Most people look at one number: how many leads. If it goes up, all is well. If it doesn't, they change the title, then the colors, then a random question.
The trouble is that the lead count doesn't say where things get stuck. A quiz can lose its visitors before the first question, in the middle, or right in front of the form, and those call for very different fixes.
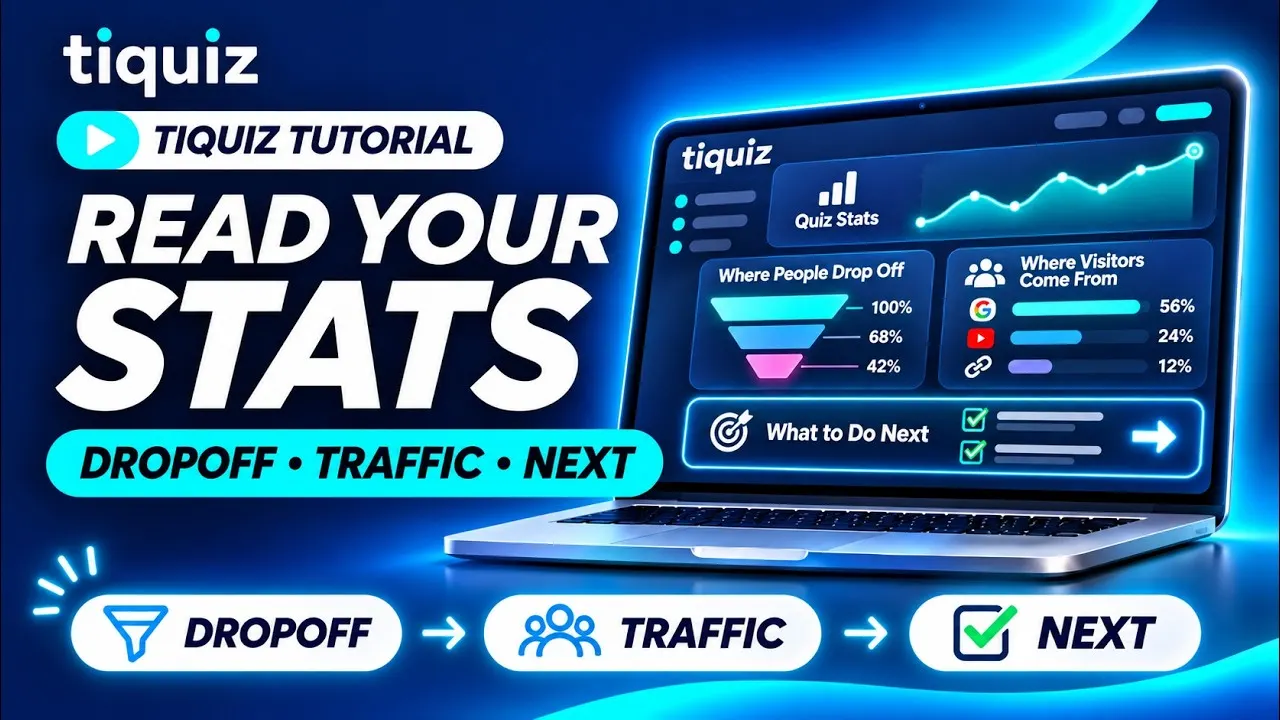
Tiquiz stats are built to answer that question. Here's how to read them, in order.
Step 1: the key numbers, in the Statistics menu
Open Statistics in the menu. At the top, choose the range: 7 days, 30 days, 90 days or All time. Every number on the page follows that choice.
- Views: visitors who opened a quiz.
- Started: those who began answering.
- Completed: those who answered every question.
- Leads: those who left their email.
- Shares: shares made from your quizzes.
- Conversion rate: leads compared with starts.
Below, the Lead acquisition chart shows leads day by day, with your best day. Then Performance per quiz compares your quizzes with each other, and Lifetime totals gives the all-time figures.
Step 2: one quiz in detail, in its Stats tab
Open a quiz and click the Stats tab. You get the same numbers for that quiz alone, with two rates not to mix up:
- the capture rate: leads compared with views. It tells you what your page does with everyone who arrives;
- the conversion rate: leads compared with starts. It tells you what your quiz does with those who began.
The Sent to your tool card shows the share of your leads that reached the connected tool. Leads over time plots them, and Distribution by result tells you which profile comes up most: that's often where offer ideas are born.
Step 3: where visitors stop, question by question
The Funnel per question is the most useful chart on the page. It follows the path in order: arrival, start, each question, the email form, then the email left. The bar shrinks with each drop-off.
Under the chart, Tiquiz spells out where the real leak is:
- before the questions: visitors leave your intro screen without seeing a single question. It's often a quiz's biggest leak, and it's fixed on a single screen;
- on a question: it's the last one seen by those who stop. That's the one to look at, not the next, which they never saw;
- after the questions: people finish and don't leave their email. Your result promise or your form stops them.
When there aren't enough people yet to conclude, Tiquiz says so instead of pointing at a random question.
Step 4: where your visitors come from
The Where your visitors come from table sorts your visits by source, with views, starts, start rate, completions and leads for each one.
It answers the question that comes before all the others: is your page disappointing, or are the wrong people landing on it? If one source starts much better than the others, your page is not the problem: the weakest source's audience is.
To see each post separately, tag your links, for example your-link?utm_source=instagram.
Step 5: the AI analysis and the PDF report
In a quiz's Stats tab, the AI analysis of your statistics block has a Run the analysis button. The AI reads your visits, completion and capture rate, then returns a diagnosis, a reading of your funnel, your visitors' profile, areas for improvement, and one thing to do now.
The AI analysis is part of PLUS plans. It needs a minimum of activity: at least 5 leads or 20 views on the quiz. In the Statistics menu, the strategic AI analysis does the same job across all your quizzes and surveys: what works, what to fix, and your next moves.
Next to the lead list, two buttons create the report: PDF summary, and Detailed PDF (no names or emails), which includes every written answer. The CSV button exports the leads themselves.
Misreadings to avoid
- Concluding too early. With a handful of visitors, one person leaving already counts for several points. Wait until Tiquiz itself points to a question.
- Changing two things at once. To measure a change: one edit, then new responses before judging. Two changes at once make the effect unreadable.
- Aiming for 100% completion. Losing people along the way is normal and healthy: the ones who stop are mostly unqualified visitors.
- Reading "Direct" as "they typed my address". Most mobile apps (Instagram, TikTok, messaging, email) don't report where the click came from. Neither does a QR code.
- Being surprised by more leads than views. The same browser counts only one view, one start and one completion per 24 hours, and your own visits made while signed in to your account are not counted.
- Forgetting you edited your questions. After a change, the funnel only counts people who came through since: the others answered a different version of the quiz.
FAQ: Tiquiz stats
Are stats included in the free plan?
Yes. The key numbers, the funnel per question and traffic sources are open on every plan. The AI analysis and the strategic analysis across all your quizzes are part of PLUS plans ($29/month or $290/year).
What's the difference between capture rate and conversion rate?
The capture rate divides your leads by your views: it measures the whole page, intro screen included. The conversion rate divides your leads by your starts: it measures the quiz itself, once the person has begun.
My own test runs are skewing my numbers. What can I do?
Visits made while signed in to your account are not counted. And if you tested your quiz another way before launching, the Reset stats to zero button starts over from a clean slate. It can't be undone: the quiz's visit history is lost.
Does the PDF report contain my leads' emails?
No. The PDF summary gathers the numbers, and the detailed PDF includes the answers with no names or emails. For the contacts themselves, use the CSV export.
How many responses do I need before running the AI analysis?
At least 5 leads or 20 views on the quiz. Below that, the AI doesn't have enough real numbers to give you accurate conclusions.